Load Balancers are critical components of modern system architecture, intelligently distributing traffic across multiple servers. This article explains in detail what a load balancer is, popular load balancing algorithms, health checks, session persistence, and real-world deployment architectures.
What is a Load Balancer?
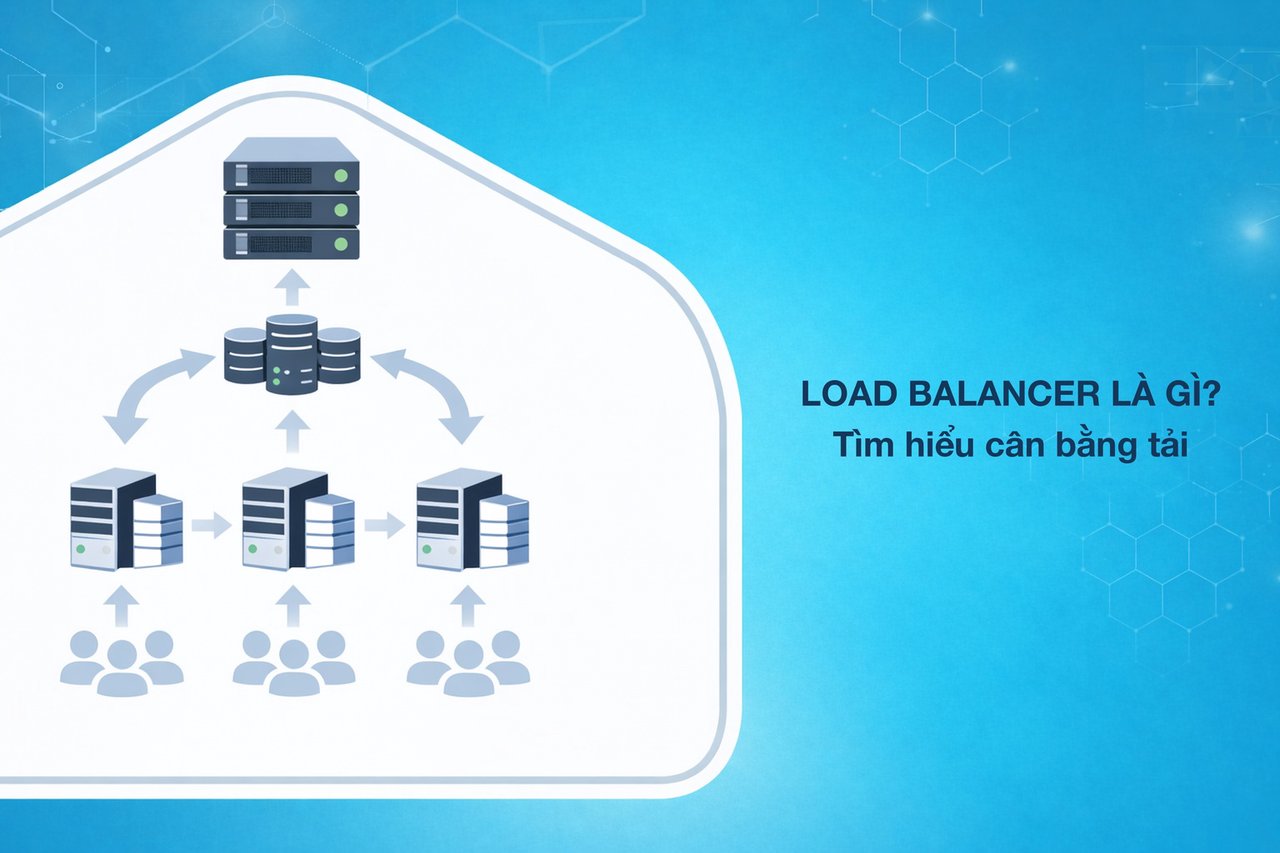
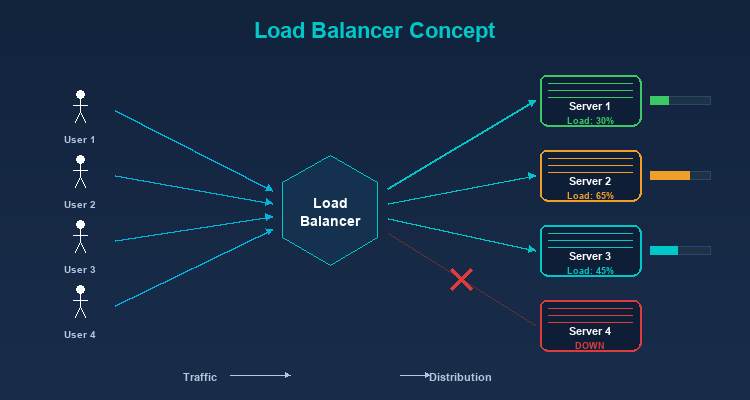
A Load Balancer is a device or software that sits between clients and a group of servers (server pool/server farm), responsible for distributing incoming user requests to backend servers so that the load is evenly spread — preventing any single server from being overwhelmed while others sit idle.
As your website or application grows and user traffic increases, a single server can no longer handle all requests. This is where a Load Balancer comes into play — intelligently distributing traffic across multiple servers to ensure your system remains stable and responsive.
A Real-World Analogy
Imagine a restaurant with 5 checkout counters. If all customers line up at just one counter, wait times would be extremely long despite 4 other counters being free. A load balancer is like the host directing customers to the least busy counter, ensuring all counters are utilized and customers wait as little as possible.
2019Trusted since
B2BData solutions
Data·AIExpertise
Need data solutions for your business?
AlgoData has helped businesses with data engineering, analytics & AI since 2019.
If you have only one server and it fails, your entire service goes down. With a load balancer:
Traffic is automatically redirected to remaining healthy servers.
The system can tolerate the failure of one or more servers without affecting users.
Achieving 99.99% uptime or higher becomes possible.
Scalability
Load balancers enable horizontal scaling — adding new servers to the pool when traffic increases, instead of upgrading existing hardware (vertical scaling). Horizontal scaling is far more flexible and cost-effective.
Optimal Performance
Even load distribution across servers ensures:
No server becomes overloaded.
Consistent response times for all users.
Maximum utilization of hardware resources.
Zero-Downtime Maintenance
You can remove individual servers from the pool for maintenance or updates without affecting the service. The load balancer automatically distributes traffic to the remaining servers.
Types of Load Balancers
Layer 4 Load Balancer (Transport Layer)
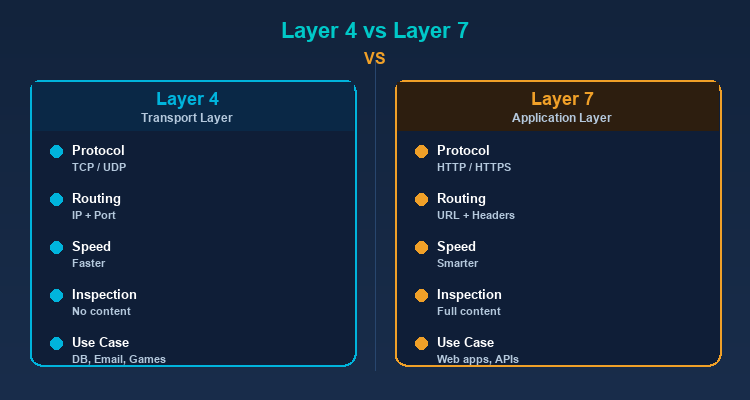
Operates at the Transport layer (TCP/UDP) of the OSI model. Makes routing decisions based on network information like source/destination IP and port number, without inspecting request content.
Characteristics:
Faster because it doesn't analyze content.
Suitable for non-HTTP services (databases, email, game servers).
Cannot route based on URL path or HTTP headers.
Layer 7 Load Balancer (Application Layer)
Operates at the Application layer, capable of reading and analyzing HTTP request content. Makes routing decisions based on URL, headers, cookies, and request body.
Characteristics:
More flexible — can route /api to API servers and /images to image servers.
Supports SSL termination, compression, and caching.
Slightly slower than Layer 4 due to content inspection.
Most popular for web applications.
Global Server Load Balancing (GSLB)
Distributes traffic at a global level, routing users to the nearest datacenter. Typically uses DNS-based routing combined with health checks.
Popular Load Balancing Algorithms
Round Robin
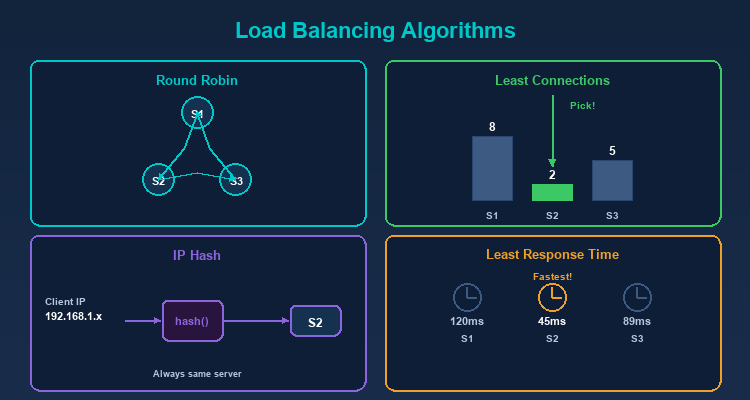
Distributes requests sequentially in a circular pattern: Server 1 → Server 2 → Server 3 → Server 1 → ...
Pros: Simple, easy to implement.
Cons: Doesn't account for actual server capacity. If servers have different specs, weaker servers will be overloaded.
Weighted Round Robin
Similar to Round Robin but assigns weights to each server. Stronger servers get higher weights and receive more requests.
Example: Server A (weight 5), Server B (weight 3), Server C (weight 2) → For every 10 requests, A receives 5, B receives 3, C receives 2.
Least Connections
Sends requests to the server with the fewest active connections. Ideal when request processing times vary — servers that finish earlier receive new requests sooner.
Weighted Least Connections
Combines Least Connections with weights. Considers both current connection count and server capacity.
IP Hash
Uses a hash of the client IP to determine the server. The same IP is always directed to the same server — ensuring session persistence without complex sticky session mechanisms.
Least Response Time
Sends requests to the server with the fastest response time and fewest connections. The smartest algorithm, ensuring users are always served by the fastest server.
Random
Selects a server randomly. Simple and surprisingly effective when server count is large and traffic is high (by the law of large numbers).
Algorithm Comparison Table
Algorithm
Complexity
Best Use Case
Session-Aware
Capacity-Aware
Round Robin
O(1)
Identical servers, short requests
No
No
Weighted Round Robin
O(1)
Mixed server specs
No
Yes (static)
Least Connections
O(n)
Varying request durations
No
Yes (dynamic)
Weighted Least Conn.
O(n)
Mixed servers, diverse requests
No
Yes (both)
IP Hash
O(1)
Session persistence needed
Yes
No
Least Response Time
O(n)
Maximum performance required
No
Yes (dynamic)
Health Checks — Server Health Monitoring
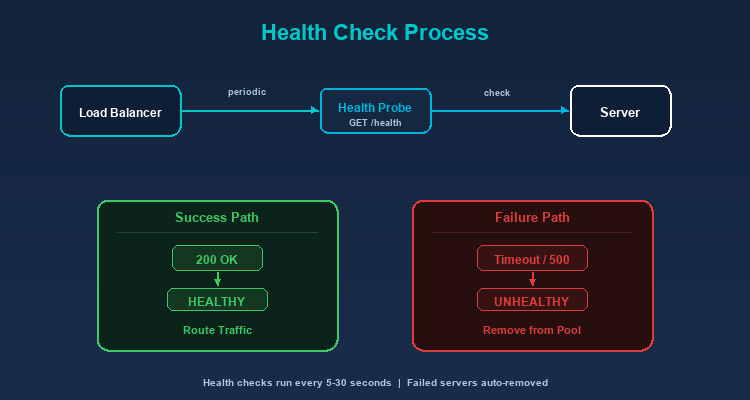
Load balancers continuously monitor the status of backend servers to ensure traffic is only sent to healthy servers.
Active Health Check
The load balancer proactively sends check requests (health check probes) to each server periodically:
HTTP Health Check: Sends a GET request to a specific endpoint (usually /health), checking for status code 200.
TCP Health Check: Verifies if a TCP connection succeeds.
Custom Check: Tests more complex conditions (database connection, disk space, memory usage).
Passive Health Check
Monitors responses from servers during actual request processing. If a server returns too many errors (5xx) or timeouts, the load balancer marks it as unhealthy.
Failure Handling
When a server is marked unhealthy:
The load balancer stops sending new requests to that server.
Current requests may be retried on another server.
Health checks continue — when the server recovers, the load balancer automatically adds it back to the pool.
Session Persistence (Sticky Sessions)
Some applications require all requests from the same user to go to the same server (e.g., shopping cart, login session). Several approaches handle this:
Cookie-Based
The load balancer adds a cookie to the response containing information about the serving server. Subsequent requests carrying this cookie are sent to the same server.
Source IP Affinity
Uses the client IP to bind to a specific server (similar to IP Hash).
Application-Level Solution
The best approach is designing stateless applications — storing session data in shared storage (Redis, database) instead of on the server. This way, any server can handle any request.
Popular Load Balancer Solutions
Software Load Balancers
Nginx: Serves as a web server, reverse proxy, and load balancer. High performance, flexible configuration, free. The most popular choice today.
HAProxy: A dedicated load balancer with extremely high performance. Used by major companies like GitHub and Stack Overflow.
Traefik: Designed for container environments (Docker, Kubernetes). Automatically discovers and configures services.
Envoy: A modern proxy for microservices architecture, developed by Lyft. Commonly used as a sidecar proxy in service meshes.
Cloud Load Balancers
AWS Elastic Load Balancing (ELB): Application Load Balancer (ALB) for Layer 7, Network Load Balancer (NLB) for Layer 4.
Google Cloud Load Balancing: Supports global load balancing with automatic scaling.
Azure Load Balancer: Integrated with the Azure ecosystem.
Hardware Load Balancers
F5 BIG-IP: An enterprise solution with premium performance and security features.
Citrix ADC: Application Delivery Controller for large enterprises.
Load Balancer and Proxy
Load balancers have a close relationship with proxies:
Reverse Proxy as Load Balancer
Nginx and HAProxy function as both reverse proxies and load balancers. They receive requests from clients, determine the appropriate backend server, and forward requests — this is the function of a reverse proxy combined with a load balancing algorithm.
Proxy Load Balancing
In systems using proxies (web scraping, ad verification), load balancers distribute requests across different proxies to optimize performance and avoid overloading a single proxy. TMProxy integrates internal load balancing to automatically distribute requests across a pool of over 10 million IPs.
Real-World Deployment Architecture
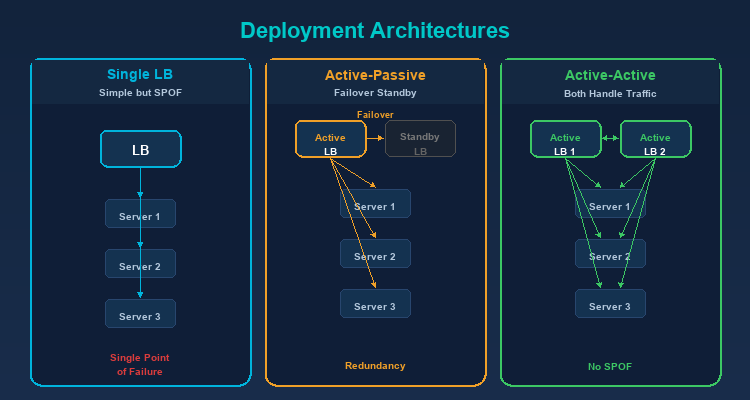
Single Load Balancer
The simplest architecture — one load balancer in front of multiple servers. Drawback: the load balancer is a single point of failure.
Active-Passive (Failover)
Two load balancers — one active handling traffic, one passive on standby. When the active fails, the passive automatically takes over (failover).
Active-Active
Both load balancers are active, sharing traffic. Better resource utilization than Active-Passive and eliminates single point of failure.
Monitoring and Key Metrics
Operating a load balancer effectively requires comprehensive monitoring. Here are the most critical metrics to track:
Requests Per Second (RPS)
The number of requests the load balancer processes per second. This metric indicates the current system load and helps predict when you need to scale. Track RPS over time to identify traffic patterns and plan capacity accordingly.
Active Connections
The number of concurrent active connections per backend server. If one server has unusually high active connections compared to others, the balancing algorithm may need adjustment, or that server may be experiencing slow request processing.
Error Rate
The percentage of failed requests (HTTP 4xx and 5xx). A sudden spike in error rate can indicate: backend server failures, deployment issues, or system overload. Set alerts when error rate exceeds normal thresholds (typically 1-5%).
Response Time (p50, p95, p99)
Response time percentiles are more important than averages. p50 shows the experience of most users, p95 reveals the experience of the slowest 5% of users, and p99 catches severe outliers. If p99 is many times higher than p50, the system has a tail latency problem.
Backend Health Status
The health check status of each backend server: healthy, unhealthy, or draining. Tracking health status history helps detect "flapping" servers (constantly switching between healthy and unhealthy) — a sign of hardware or configuration issues.
Bandwidth (Throughput)
The amount of data (bytes) passing through the load balancer per second. Monitoring bandwidth ensures you don't exceed network interface limits and helps plan upgrades when needed. Unusual bandwidth patterns may indicate DDoS attacks or data leaks.
Popular Monitoring Tools: Prometheus + Grafana is the most widely used combination for load balancer monitoring. Datadog, New Relic, and AWS CloudWatch are also popular choices for cloud environments.
Don't ignore p99 latency
Average values can hide serious problems. If p99 is 10x higher than p50, 1% of your users are having a terrible experience — enough to impact conversion rate and brand image. Always alert on p95/p99, not averages.
Real-World Case Studies
Netflix — Global-Scale Load Balancing
Netflix serves over 200 million users worldwide using a multi-layered load balancing architecture. At the global tier, Netflix uses DNS-based load balancing to route users to the nearest AWS region. At the regional tier, Zuul (their custom API gateway) acts as a Layer 7 load balancer, distributing requests to thousands of microservice instances. Netflix also developed Eureka for service discovery and Ribbon for client-side load balancing, enabling each service to load-balance its own calls to other services.
GitHub — HAProxy for Millions of Developers
GitHub uses HAProxy as its primary load balancer, handling millions of git operations and web requests daily. HAProxy was chosen for its extremely high performance and ability to handle hundreds of thousands of concurrent connections. GitHub deploys an Active-Active architecture with multiple HAProxy instances, combined with custom health checks to ensure traffic only routes to properly functioning servers. During maintenance, individual servers are gracefully drained of traffic through the load balancer.
E-Commerce Flash Sales — Handling Traffic Spikes
During flash sale events (Singles' Day, Black Friday), traffic can surge 10-50x above normal levels within seconds. E-commerce platforms use multi-tier load balancing strategies: Global load balancers distribute across datacenters, Application load balancers distribute across server groups (product catalog, cart, payment), and each group auto-scales based on load balancer metrics. Queue systems (Redis, RabbitMQ) sit behind the load balancer to throttle traffic to sensitive services like payment processing.
Conclusion:Load Balancers are essential components of modern system architecture, ensuring applications remain available, fast, and scalable. Whether you're running a small website or a complex microservices system, understanding load balancing will help you design robust infrastructure ready to handle any level of traffic.
A Load Balancer is a device or software that sits between clients and a group of servers, distributing incoming requests across backend servers to spread the load evenly. It continuously checks server health and only sends traffic to servers that are functioning properly.
QWhat is the difference between Layer 4 and Layer 7 Load Balancers?
Layer 4 operates at the Transport layer, routing based on IP and port — fast but inflexible. Layer 7 operates at the Application layer, reading HTTP requests — more flexible, capable of routing by URL path, headers, and cookies.
QWhich load balancing algorithm is most popular?
Round Robin is the simplest and most popular for identical servers. Least Connections works well with varying request durations. Weighted Round Robin suits mixed server specs. Least Response Time is the smartest but more complex.
QDo small websites need a Load Balancer?
Small websites with a single server may not need one initially. However, when traffic grows or high uptime (99.99%) is required, a load balancer becomes essential to eliminate single points of failure and enable horizontal scaling.
QWhat is a sticky session and when should I use it?
A sticky session (session persistence) ensures requests from the same user always go to the same server. It's needed when applications store session data on the server (shopping cart, login). A better approach is designing stateless apps with shared storage like Redis.