What Is RFM?
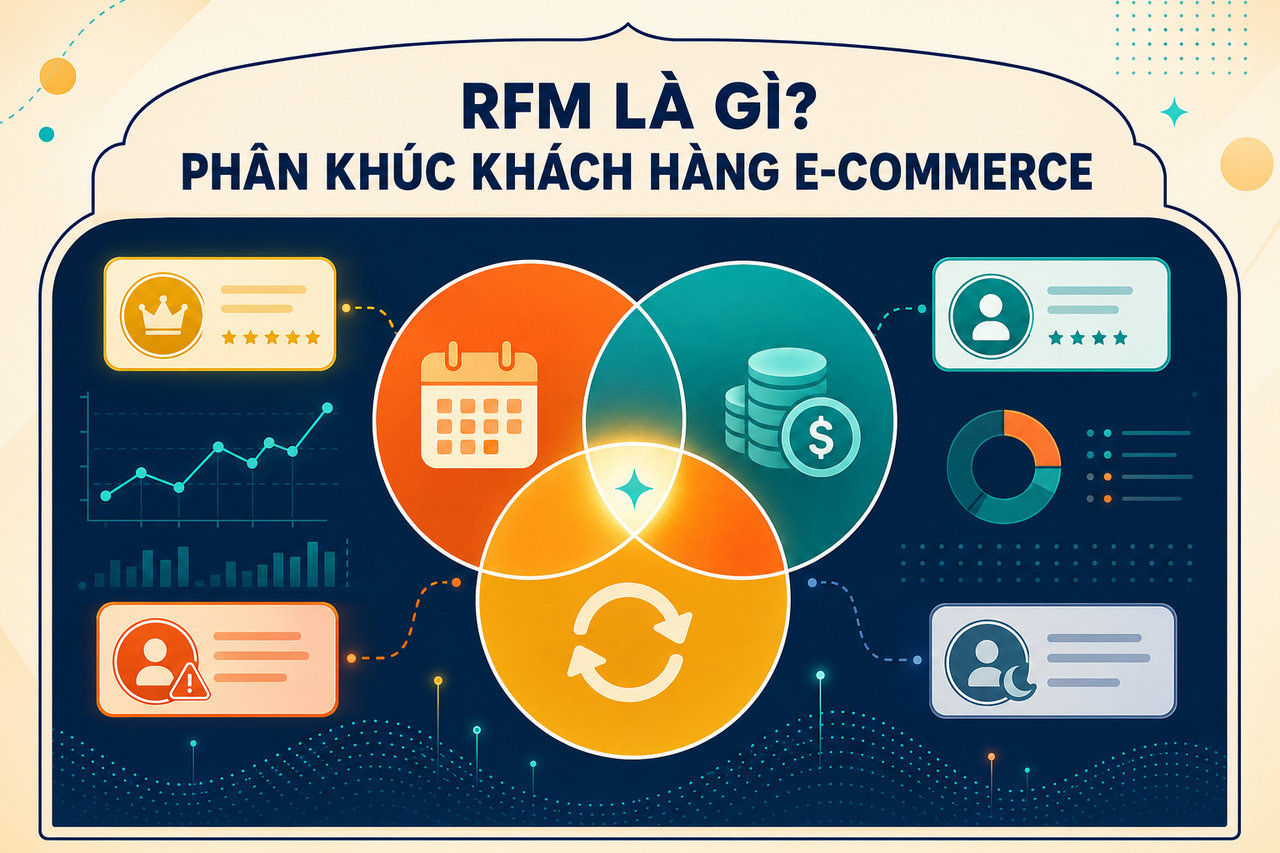
RFM stands for three core metrics used to analyze customer purchasing behavior: Recency, Frequency, and Monetary. Combined, these three dimensions create a comprehensive, quantifiable portrait of every individual customer — the kind of portrait that intuition or casual observation cannot produce when you are managing tens of thousands of buyers simultaneously.
R — Recency: How recently did this customer last make a purchase? This axis measures the freshness of the relationship between the customer and the brand. A customer who placed an order two days ago has a far higher Recency score than someone whose last transaction was nine months ago. The foundational principle — repeatedly validated across decades of marketing research — is that the more recent a transaction, the more likely the customer is to respond to any form of marketing outreach. Recency works because the brand is still fresh in the customer's mind and the purchasing behavior itself can activate related latent needs.
F — Frequency: How many orders did this customer place within the analysis window — typically six or twelve months? High Frequency reflects an established purchasing habit and genuine brand affinity. These are not customers who showed up once because of a flash promotion and then disappeared. They are buyers who have voluntarily returned multiple times because they trust the product and genuinely enjoy the purchasing experience. Frequency is the most honest signal of true loyalty because it cannot be easily distorted by momentary emotion or one-time discounts.
M — Monetary: What is the total value this customer has spent during the analysis period? Monetary separates customers with real financial value from those who may purchase often but only at very low price points. A customer who places twenty orders at 50,000 VND each represents a very different economic profile from one who places five orders at 2 million VND each. When allocating marketing resources, Monetary helps the brand identify who truly deserves the greatest investment.
When the three axes of R, F, and M are combined, they form a three-dimensional space in which every customer occupies a distinct position. From that position, a brand can determine which segment the customer belongs to and what treatment is most appropriate — not through guesswork or intuition, but through data that is consistently recalculated as behavior evolves.
The origins of RFM trace back to the 1990s, when it was developed for the direct mail marketing industry in the United States. The original problem was highly practical: given a list of millions of addresses, which customers most warranted the cost of printing and mailing a physical catalog? The answer — customers who had purchased recently, who had purchased multiple times, and who had historically spent more — proved to be the strongest predictors of future purchase behavior. Today, RFM is applied broadly across e-commerce, retail banking, telecommunications, subscription services, and any industry that generates recurring transactional records.
To illustrate with concrete numbers: Customer Nguyen Van A purchased three days ago, has placed fifteen orders in the past year, and has spent a total of eight million VND. This is the profile of a typical Champions customer — someone the brand should treat as a genuine VIP. By contrast, Tran Thi B last purchased 180 days ago, has placed only two orders in the past year, and has spent 300,000 VND in total. That profile belongs to the At-Risk or Hibernating segment and requires an entirely different strategic approach and marketing budget allocation.
Why RFM Matters in E-Commerce
In today's e-commerce environment — where advertising costs on Shopee, TikTok, and Facebook continue to climb and brand competition across categories grows more intense with each quarter — RFM provides the analytical foundation for strategic resource allocation rather than the broadcast approach of sending the same message to everyone and hoping the conversion rate justifies the cost.
The Pareto 80/20 Principle — the uncomfortable truth many brands avoid: Research conducted across Southeast Asian e-commerce markets consistently shows that approximately 20% of customers generate around 80% of revenue. This is a significant asymmetry. RFM is the instrument that precisely identifies which 20% those customers are — enabling the brand to invest disproportionate attention and care in retaining them, rather than letting them drift away while the marketing team focuses entirely on acquisition campaigns for new buyers.
Systematic reduction of marketing spend waste: Rather than sending the same campaign blast to an entire customer list and hoping the aggregate conversion rate covers the cost, RFM enables the brand to target exactly the right segment with exactly the right message. A win-back campaign only needs to reach At-Risk customers — not Champions who are already highly active and may actually feel annoyed by a coupon they have no need for. An onboarding sequence only needs to reach New Customers, not Loyal Customers who have already placed ten orders. The practical results: higher open rates, better conversion rates, and a lower cost per action across every campaign type.
Shifting from reactive to proactive retention: One of the hardest problems in e-commerce is knowing who is about to churn before they actually churn. RFM solves this by tracking each customer's Recency signal over time. When a previously high-Frequency customer stops purchasing — no order this week, no order this month — that is an early warning signal. The brand can intervene before losing that customer entirely. This is the transition from reactive thinking (realizing churn happened after the fact) to proactive management (preventing churn before it occurs).
Lower Customer Acquisition Cost through prioritized retention: Research from Bain & Company and Harvard Business School indicates that retaining an existing customer typically costs five to seven times less than acquiring a new one. An existing customer already knows the brand, trusts the product, and does not need to be convinced from the ground up. RFM helps brands invest appropriately in retention rather than continuously pouring budget into acquisition while neglecting a customer base that has already demonstrated willingness to buy.
Personalization that carries genuine meaning: Champions receive early access to product launches and exclusive partner deals. Potential Loyalists receive second-purchase incentives with modest discounts. At-Risk customers receive win-back campaigns with emotional triggers. Lost customers receive deep discount offers as a final attempt. Each group receives the specific message that corresponds to their current stage in the relationship with the brand — rather than everyone receiving the same generic weekly newsletter.
Industry benchmarks and evidence-based self-assessment: In Vietnamese e-commerce, actual data from multiple product categories shows that the Champions segment typically represents only 10 to 15% of a brand's total buyer base while contributing 40 to 50% of revenue. Understanding these ratios for your own brand — and comparing them against category-specific benchmarks — allows the marketing team to set realistic, data-grounded retention KPIs instead of targets based on intuition or borrowed from an irrelevant industry comparison.
How to Calculate an RFM Score — A Step-by-Step Guide
Calculating RFM from raw transaction data follows a systematic four-step process. The explanation below is detailed enough for a marketing analyst without a data science background to execute independently:
Step 1: Define the analysis time window.
The most widely used window is the twelve months immediately preceding the analysis date. For categories with shorter purchase cycles — FMCG, everyday cosmetics, supplements — six months may be sufficient and will produce a more current picture. For categories with longer purchase cycles — home appliances, furniture, premium electronics — consider extending to eighteen or twenty-four months to ensure enough transactions per customer, since a twelve-month window for high-cycle categories often leaves most of the buyer base with only a single order and no meaningful Frequency signal.
Step 2: Calculate three base values per customer.
From the order history table, aggregate the following for each unique customer ID: (1) the date of the most recent order — used to calculate how many days have elapsed since then as of the reference date; (2) the total number of orders placed within the time window; (3) the total order value across all transactions, net of any confirmed refunds. The output is a table with three numeric columns corresponding to the raw R, F, and M values before score conversion.
Step 3: Divide each metric into quintiles — five equal groups scored 1 through 5.
For Recency: the customer who purchased most recently receives a score of 5 (best), and the customer with the oldest last purchase receives a 1. Important note: Recency is measured in days elapsed since the last purchase — fewer days means a higher score. Do not invert this accidentally when assigning quintiles.
For Frequency: the customer with the most orders receives a 5, and the customer with the fewest receives a 1. Frequency distributions in e-commerce are typically heavily right-skewed — the majority of buyers have placed only one or two orders. Applying a logarithmic transformation before splitting into quintiles prevents the common problem where four of the five quintiles all collapse into "one order," making segmentation meaningless.
For Monetary: the highest spender receives a 5, and the lowest spender receives a 1. As with Frequency, consider a log transform before quintile splitting to handle the right-skewed distribution that characterizes most e-commerce monetary data.
Step 4: Concatenate the three scores into a single RFM score.
Join the three digit scores in R-F-M order. Example: R=5, F=4, M=5 produces an RFM score of 545. You can use this three-digit score directly to classify customers into the named segments below, or calculate a single summary score as the arithmetic mean: (R+F+M) ÷ 3.
Practical example with real data:
| Customer |
Last Purchase |
Orders/Year |
Total Spent |
R |
F |
M |
RFM |
Segment |
| Nguyen Van A |
3 days ago |
12 orders |
15M VND |
5 |
4 |
5 |
545 |
Champions |
| Tran Thi B |
90 days ago |
5 orders |
3M VND |
2 |
3 |
3 |
233 |
Needs Attention |
| Le Minh C |
7 days ago |
1 order |
500K VND |
5 |
1 |
2 |
512 |
New Customers |
| Pham Thu D |
200 days ago |
8 orders |
12M VND |
1 |
4 |
5 |
145 |
At-Risk |
| Hoang Lan E |
15 days ago |
3 orders |
4M VND |
4 |
2 |
3 |
423 |
Potential Loyalists |
The table immediately reveals the key strategic insight: Pham Thu D has high Frequency and Monetary scores but an extremely low Recency score. This was a genuinely loyal customer now in a dangerous churn phase — they should be the absolute top priority in any win-back campaign. Le Minh C purchased recently but only once — they need a structured onboarding sequence to convert into a Potential Loyalist before the initial engagement fades.
The 8 Most Common RFM Customer Segments
Once RFM scores are calculated, the next step is mapping those scores to strategic segments. There is no single universal standard for this mapping — each brand and category can adjust the thresholds to fit their specific business model. Below are the eight groups most commonly used in e-commerce practice, with characteristics and strategic definitions for each:
Champions (R4-5, F4-5, M4-5): The genuine VIP tier — buying frequently, recently, and spending the most among all groups. These customers are natural brand advocates with the highest likelihood of driving referrals without being asked. This group typically represents 10 to 15% of the buyer base but generates 40 to 50% of revenue. Critical mistake to avoid: treating Champions as "stable" and deprioritizing them. They need to continuously feel recognized and special — otherwise a competitor offering a better experience will pull them away.
Loyal Customers (R3-4, F4-5): Purchasing consistently with high frequency, even if not necessarily the biggest spenders per transaction. This group has built a durable relationship with the brand. Unlike Champions, their Monetary may be moderate but their Frequency is exceptionally high — they show up for nearly every sale, every new product launch, every restocking event.
Potential Loyalists (R4-5, F2-3): Recent buyers showing early signals of forming a purchasing habit. This is the highest-potential "rising" segment: with proper nurturing, today's Potential Loyalists become tomorrow's Champions or Loyal Customers. Without nurturing, they drift toward Promising and eventually Needs Attention.
New Customers (R5, F1): They have just completed their first order. The first thirty days represent the critical window — brand awareness is high, the product is fresh in their hands, and they are at their most receptive. The rate at which brands convert first-time buyers into second-time buyers is one of the largest differentiators between high-retention brands and those perpetually chasing new acquisition to replace churned customers.
Promising (R3-4, F2-3): Has purchased a few times relatively recently but has not yet committed to the brand at a Loyal level. This group has potential but needs a gentle push — not deep discounts, just timely reminders and social proof to move them up a tier.
Needs Attention (R2-3, F2-3, M2-3): Previously average-value customers becoming less active over time. Without intervention in the next 30 to 60 days, this group will slide into At-Risk. They need a light re-engagement approach — not as intensive as At-Risk treatment, but not to be ignored either.
At-Risk (R2, F3-5, M3-5): The segment demanding the most urgent strategic attention. These were loyal customers — high Frequency and Monetary — whose Recency is now declining sharply. The clear signal: they are switching to a competitor. Every week without an intervention is a week lost. Win-back campaigns for At-Risk customers must be fast, highly personalized, and carry a compelling enough offer to disrupt whatever alternative behavior they have developed.
Lost/Hibernating (R1, F1-2, M1-2): No purchase for a long time and historically low engagement. The cost of reactivation typically outweighs the expected return, especially for customers whose historical Monetary was also low. Be strategic: invest only in previously high-Monetary Lost customers, and accept churn for the rest — redirecting that budget toward nurturing Potential Loyalists where the ROI is demonstrably better.
RFM With AlgoData
AlgoData integrates automated RFM analysis directly into its customer analytics dashboard, enabling brands to run continuous, systematic customer segmentation without requiring a dedicated data engineering team or any programming knowledge.
End-to-end automation — zero manual effort: Instead of manually exporting CSV files from Shopee Seller Center every week, running Excel pivot tables or writing Python scripts to calculate quintiles, and then manually classifying each customer into a segment, AlgoData automatically pulls transaction data from Shopee and TikTok Shop Analytics on a scheduled basis, recalculates RFM scores for the complete buyer base, and refreshes the dashboard — without any action required from the brand. The difference between RFM as a one-time project and RFM as a continuously operating system is exactly this automation layer.
Customizable segmentation thresholds for each industry: Not every vertical shares the same behavioral definition of "loyalty." A fast-moving cosmetics brand might reasonably define loyal as four or more purchases per year. A premium home appliances brand might consider one or two purchases per year a strong loyalty signal. AlgoData allows brands to configure the segmentation thresholds to match their specific industry, average purchase cycle, and business model — avoiding the distortions that come from applying a generic one-size-fits-all threshold to specialized markets.
Multi-platform data aggregation — a unified customer view: If a brand operates on both Shopee and TikTok Shop, AlgoData can aggregate transaction data from both platforms to calculate a unified RFM score per customer. This eliminates the case where a customer appears "New" on Shopee when they have actually been a loyal buyer on TikTok Shop for many months. A single-channel view produces systematically incomplete information; a unified cross-platform view is what brands actually need for reliable segmentation decisions.
Trend tracking over time — objective marketing effectiveness measurement: Beyond the current-day snapshot, AlgoData enables brands to visualize how segment sizes shift month over month. Is the Champions group growing or contracting? Has the At-Risk group decreased following last month's win-back campaign? Are New Customers converting to Potential Loyalists at the expected rate? These trend charts are the most objective basis for evaluating marketing program effectiveness — far more reliable than looking at total GMV or revenue, which can be influenced by many external factors unrelated to retention.
Customer-level drill-down — from segment overview to individual profiles: From the segment summary view, a brand can click into any group to access a list of individual customers, their complete order history, products purchased, and detailed RFM scores. This depth of access is particularly valuable for account managers personalizing outreach to key VIP clients, or for analysts trying to understand the behavioral patterns of a specific high-value segment.
Export and CRM sync — connecting insight to action: Once the target segment is identified, brands can export the customer list directly from AlgoData and sync it into email marketing platforms (Mailchimp, Klaviyo, GetResponse) or CRM systems (HubSpot, Salesforce, Bitrix24) to trigger segment-specific automation workflows. This is the critical last mile that connects analytical insight to actual marketing execution.
Marketing Strategies by RFM Segment
The real value of RFM is not in the segmentation itself — it is in the actions that follow. Every segment requires a distinct strategy calibrated to the psychological state and relationship stage of the customers within it:
Champions — Protect VIP status and activate structured advocacy:
The most common mistake brands make with Champions is sending them additional discounts. They already buy without discounts. Offering them a coupon accomplishes nothing except margin erosion. Instead, give them recognition and exclusive access they cannot get anywhere else.
In practice: early access means inviting them to view and order new products 48 hours before the official launch — communicating clearly that "you are among the first to know." Co-creation means soliciting their input on upcoming product designs, color selections, or feature priorities — customers who are asked for their opinion develop a sense of ownership over the brand that discounts cannot buy. A referral program designed specifically for Champions converts their natural advocacy into a structured acquisition channel with measurable ROI.
Loyal Customers — Sustain engagement and reward meaningfully:
Accumulating loyalty points with a clear redemption calendar, personalized birthday vouchers sent on the actual birthday rather than sometime during the birthday month, and exclusive member deals on brand milestone occasions such as the brand anniversary or major seasonal moments. The objective is to reinforce the purchasing habit and deepen brand affinity — not to push another conversion, since they are already converting consistently.
Potential Loyalists — Accelerate the path to Loyal:
A modest second-purchase discount of 10 to 15% delivered at precisely the right moment after the first order — typically between day 7 and day 14, when the product has arrived and is being used and the customer is at their most positive emotional state regarding the brand. Pair this with personalized product recommendations based on the category of the first purchase: if they bought a serum, suggest the complementary moisturizer from the same product line or the same brand philosophy.
New Customers — Build a strong first impression and create a structured journey:
A thirty-day onboarding email sequence: day 1 sends a warm welcome message with a product usage guide for the item they just purchased; day 7 sends unboxing tips, care instructions, and the brand story; day 14 sends personalized product recommendations based on their first purchase category; day 21 sends an invitation to join the loyalty program with a first-join benefit. Each touchpoint builds an additional layer of trust and emotional connection with the brand before that initial engagement fades.
At-Risk — Urgent win-back with genuine urgency mechanics:
A "We miss you" campaign combining a meaningful discount of 20 to 25% with a genuine countdown timer that expires in 72 hours — not 30 days, because a distant deadline creates no psychological urgency. The message must be personalized: reference the specific product name they previously purchased, and highlight an upgraded version or a highly rated complementary product. If the first touchpoint generates no response, send a follow-up after three days using a completely different angle — social proof such as "5,000 customers reordered this exact product this week, here is why they came back."
Lost/Hibernating — Last resort campaign or deliberate acceptance of churn:
Invest in reactivation only for customers whose historical Monetary was in the top quartile of your buyer base. For them, a deep discount of 30 to 40% or a free gift bundled with a qualifying minimum order may represent a compelling enough reason to return. After two outreach attempts without any response, deliberately accept churn and stop allocating marketing budget to this cohort — redirect those resources to nurturing Potential Loyalists, where the ROI is substantially better.
Needs Attention — Gentle re-engagement with social proof:
Reminder campaigns that feature top-selling items in their previously preferred category alongside authentic reviews from buyers with similar spending profiles and geographic locations. The goal is re-engagement without making the communication feel overtly sales-driven. Tone should be informative and low-pressure, without urgency mechanics or heavy discounting.
Promising — Light-touch nudges at the right moment:
Wishlist reminder messages when a product they saved goes on sale; flash sale alerts for categories they have browsed multiple times; limited-inventory notifications for items they have viewed repeatedly. Avoid deploying heavy discounts with this group — their relationship with the brand is not yet deep enough to justify it, and early heavy discounting conditions them to purchase only when there is a sale rather than building a genuine engagement habit.
The Limitations of RFM
As powerful and well-validated as RFM is, it is not a universal solution. Understanding precisely where it falls short helps you combine it intelligently with other analytical methods and prevents overconfident decisions based on incomplete information:
Seasonal bias — the risk of systematic misclassification: Customers who purchase heavily during Tet, 11.11, or 12.12 shopping festivals may be classified into higher segments than their baseline behavior actually warrants — particularly when the analysis time window includes those peak events. A customer who normally purchases once or twice a year but placed five orders in a single day during a mega-sale event will have their Frequency score temporarily inflated by a single event. Mitigation: compare the same customer's RFM scores at multiple points throughout the year, and consider applying lower weighting to peak-season transactions when calculating the Frequency score.
No product preference or category affinity signal: A high RFM score indicates that a customer buys often and spends significantly, but it says absolutely nothing about which product categories they prefer, which product lines they are loyal to, or the reasons behind their purchasing decisions. Two customers with identical RFM scores of 545 can have entirely different needs and category preferences. Marketing them with the same creative and the same product recommendations will be ineffective for at least one of them.
Single-channel limitation — the incomplete picture problem: If the brand only has transactional data from Shopee but customers actually purchase across multiple channels — TikTok Shop, the brand's own website, offline retail locations — then RFM calculated from a single source will systematically misrepresent the true purchasing behavior of many customers. A customer who appears "At-Risk" on Shopee may be entirely active and satisfied on TikTok Shop. Spending win-back budget on someone who is not actually at risk wastes resources that should go elsewhere.
Non-transactional engagement is completely invisible: Customers who follow the brand's social account, watch product review videos to completion, save items to their wishlist, engage with posts and comments, or refer friends verbally without completing a tracked transaction — all of these behaviors signal meaningful purchase intent and brand affinity. None of them are captured by RFM analysis. Pure RFM sees transactions only; it cannot see interest, intent, or the social engagement that often precedes a transaction.
Recommended complementary approaches for complete customer intelligence:
To build a full customer intelligence capability, use RFM as the solid starting point and progressively add:
CLV (Customer Lifetime Value) to predict future value — RFM tells you where customers are today, CLV tells you how much each is worth investing in going forward. The combination of backward-looking segmentation and forward-looking value prediction gives you both immediate tactical action and long-term strategic investment allocation.
Behavioral data — browsing history, wishlist additions, cart abandonment events — to enrich customer profiles and understand the real purchasing intent behind the transactional behavior that RFM captures.
Survey and NPS data to surface the motivations and pain points that explain why customers buy, why they stop, and what they want from the brand in the future.
Cohort analysis to track how groups of customers defined by their acquisition date evolve over their lifetime — a critical complement to RFM's current-state segmentation, providing the longitudinal view of customer lifecycle that RFM alone cannot deliver.
Conclusion
RFM is conceptually straightforward but operationally powerful — a framework born in 1990s direct mail marketing that remains deeply relevant in the digital e-commerce era. The reason for its enduring utility is simple: regardless of whether the channel is a printed catalog or a TikTok Shop product listing, the fundamental patterns of human purchasing behavior remain consistent. Customers who have bought recently, who buy often, and who spend the most are invariably the most valuable to the brand and the most likely to continue purchasing in the future.
With AlgoData, the entire RFM pipeline — data ingestion, score calculation, segment classification, trend visualization, and customer-level export — is fully automated and continuously refreshed from live Shopee and TikTok Shop transaction data. Brands do not need an in-house data analyst, SQL proficiency, or any programming knowledge to begin operating RFM analysis from day one. The dashboard is ready from the moment the data connection is established, and scores refresh weekly without any manual intervention.
The practical path forward: start with RFM today to gain a clear, data-driven picture of your current customer base. Then progressively layer in CLV to understand which customers deserve the greatest long-term investment, and add behavioral data to personalize campaigns at a more granular level. This is the roadmap from foundational to advanced customer intelligence — scalable and accessible for e-commerce brands of any size, from an emerging shop with a few thousand buyers to an established brand managing hundreds of thousands of active customers.
If you would like to see an RFM dashboard built from your brand's actual transaction data, contact AlgoData to request a demo. We will segment your complete buyer base and walk you through the detailed findings in the first working session — no preparation needed on your side.
Related articles: