Vietnam's social media landscape has grown into one of Southeast Asia's most dynamic influencer markets.
With over 70 million active users across TikTok, Instagram, Facebook, and YouTube, the country offers brands unparalleled reach potential.
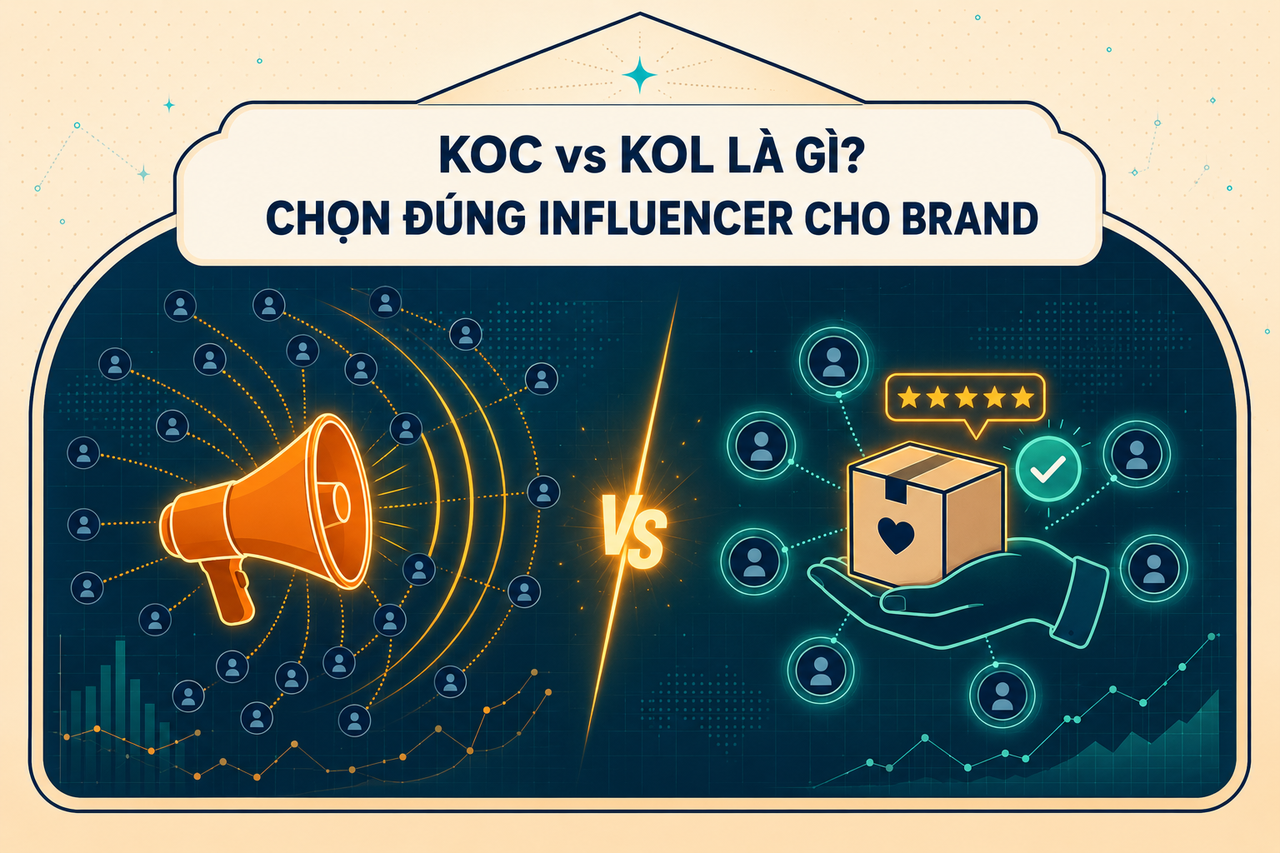
Yet as brands compete for attention in this crowded space, a critical distinction has emerged: the difference between KOL and KOC.
Many brands still conflate the two, or default to KOLs out of habit, and end up spending significant budgets on campaigns that generate impressive impressions but disappointing conversion numbers.
This article breaks down the core differences, provides a practical framework for choosing between them, and demonstrates how data can take the guesswork out of influencer strategy.
1. What Is a KOL (Key Opinion Leader)?
A Key Opinion Leader is an individual who has built a large, recognizable public presence in a specific field or across social media more broadly.
KOLs include celebrities, industry experts, athletes, entertainers, and professional content creators who have accumulated significant follower counts through sustained public activity.
Their reach is the central value proposition that makes KOLs attractive for brand campaigns seeking fast, wide audience exposure.
The most commonly used classification tiers divide KOLs into three groups based on follower count:
The defining characteristic of a KOL is scale.
A single post from a mega-KOL in Vietnam's beauty or lifestyle space can generate 2-5 million impressions within 24 hours.
This makes KOLs the natural choice when a brand needs to establish awareness quickly and broadly.
This applies especially to new product launches, rebranding campaigns, and major seasonal pushes like Tet, Singles' Day (11.11), or year-end shopping periods.
Their established credibility in a given domain also helps brand association in meaningful ways.
Partnering with a respected dermatologist-KOL for a skincare line, for instance, lends immediate category authority that a brand building from scratch cannot easily manufacture.
The association between a well-known name and a new product can compress the trust-building timeline from months to days.
For brands entering a competitive category, a KOL's existing audience relationship provides a shortcut to awareness that paid advertising channels struggle to replicate at equivalent cost.
The trade-offs are equally significant and should factor into every planning decision.
Top-tier KOL partnerships in Vietnam are expensive, with mega-KOL rates often running 50-200 million VND per sponsored post.
This is before factoring in production costs, usage rights, revision rounds, and agency management fees that can add 30-50% on top of the headline rate.
Additionally, audiences who follow large KOLs are accustomed to a steady stream of brand collaborations, which can reduce the perceived authenticity of any given endorsement.
As follower counts rise, engagement rates tend to decline in a consistent and well-documented pattern.
Mega-KOLs often see TikTok ER of only 1-3%, compared to the platform's broader average of 5-9%.
A further challenge is the growing prevalence of fake followers in Vietnam's influencer market.
Many KOLs have purchased follower services to inflate their numbers, while actual engagement from real people remains very low.
Without proper analytical tools, brands are easily misled by impressive follower counts that do not reflect real audience value or purchasing intent.
The AlgoData Fake Follower Score addresses this directly by analyzing follower behavior across multiple data dimensions to surface the truth behind the numbers.
Brands that skip follower quality audits risk investing heavily in audiences that will never see, engage with, or act on sponsored content.
2. What Is a KOC (Key Opinion Consumer)?
Key Opinion Consumer is a concept that emerged prominently around 2020, driven by TikTok's explosive rise and a broader consumer shift toward authentic, peer-sourced content.
Unlike KOLs, KOCs are not professional influencers or celebrities who build a personal brand as their primary occupation.
They are regular consumers who have purchased and genuinely used a product, then share honest, first-hand reviews on social media out of genuine motivation.
Their follower counts typically range from 1,000 to 50,000 — far smaller than most KOLs by any measure.
However, their communities tend to be highly engaged and deeply trusting, which translates into measurably better performance at comparable cost levels.
The power of a KOC lies in perceived authenticity that cannot be manufactured or replicated through professional content creation.
When an audience follows a KOC, they understand they are watching someone "like them" — same income range, same skin concerns, same daily lifestyle — rather than a paid spokesperson reading from a carefully crafted brand brief.
According to Nielsen's 2024 Global Trust in Advertising report, 92% of consumers trust recommendations from peers over any other form of advertising including TV, search, and social display.
This trust directly translates to behavior: KOC content on TikTok routinely achieves engagement rates of 8-15%.
By comparison, mega-KOL content in the same category typically achieves 1-3% — a 5-10x difference in ER that has enormous implications for cost efficiency and campaign planning.
KOCs have become especially influential in fast-moving consumer goods categories.
This includes beauty, food and beverage, personal care, and home goods — categories where purchase decisions are strongly shaped by social proof and word-of-mouth rather than broadcast advertising.
A seeding campaign deploying 50-100 well-selected KOCs can generate thousands of content touchpoints across TikTok, Instagram Reels, and YouTube Shorts simultaneously.
The total budget can equal or even come in below the cost of a single macro-KOL post, while generating substantially higher total engagement volume across the board.
This is why leading FMCG and beauty brands in Vietnam are increasingly adopting a KOC-first or KOC-heavy approach to influencer strategy in 2024 and 2025.
KOC content also has significantly longer shelf life compared to KOL promotional posts.
An authentic skincare review video from a KOC can continue surfacing in TikTok search results and algorithm recommendations for weeks or even months after the original posting date.
In contrast, a KOL promotional post is typically buried in the feed within a few days as the algorithm moves on to newer content.
This compounding effect means KOC campaigns generate better ROI over time, particularly when tracked on a 90-day rather than 7-day measurement horizon.
3. KOL vs KOC: A Direct Comparison
Understanding how KOLs and KOCs differ across key performance dimensions is essential for making smart influencer budget allocation decisions.
The table below summarizes the most important contrasts across nine dimensions that matter most for planning:
| Dimension |
KOL |
KOC |
| Typical follower range |
100K – 10M |
1K – 50K |
| Average Engagement Rate |
1 – 4% |
6 – 15% |
| Cost per post |
10M – 200M VND |
500K – 5M VND |
| Perceived trust level |
Moderate |
High |
| BOFU Conversion Rate |
Low – Moderate |
High |
| Campaign deployment time |
2 – 4 weeks |
1 – 2 weeks |
| Content control |
High (clear brief) |
Lower (authenticity-first) |
| Fake follower risk |
Higher |
Lower |
| Content longevity |
3 – 7 days |
4 – 12 weeks |
On raw reach, KOLs dominate without question and this advantage should not be dismissed.
A single macro-KOL post can deliver 500K-2M impressions that would take 30-50 KOCs to match in aggregate volume.
However, when the comparison shifts to cost efficiency, the picture reverses decisively in favor of the KOC channel.
KOC campaigns typically deliver CPM (cost per thousand impressions) 40-60% lower than comparable KOL placements at equivalent total budget levels.
When measured by CPE (cost per engagement), the advantage grows to 3-5x in favor of KOCs across most FMCG categories in Vietnam.
Conversion is where the KOC advantage becomes most pronounced and where the financial argument for KOC investment is strongest.
Data from beauty and personal care campaigns in Vietnam consistently shows KOC-driven conversion rates of 4-8% from content click to purchase action.
For KOL placements in the same product category, conversion rates typically sit at 1-3% — a meaningful and consistent gap.
The mechanism is straightforward: a viewer who identifies with a KOC — someone with a similar skin type, budget, and daily lifestyle — finds the KOC's experience more directly applicable to their own purchasing situation.
The shorter the psychological distance between reviewer and viewer, the more actionable and trustworthy the recommendation becomes in practice.
One additional dimension worth noting is the quality of audience interaction on KOC content versus KOL content.
KOL content typically accumulates passive likes and generic comments, while KOC content stimulates genuine question-and-answer exchanges about product specifics.
Followers ask KOCs about texture, scent, where to buy, how to apply, and how long before results appear — the exact questions real buyers ask before committing to a purchase.
This organic social proof cannot be manufactured and represents some of the most persuasive product content a brand can have associated with its product page or search results.
4. When to Use KOL, When to Use KOC
The most effective approach is not to choose between KOL and KOC, but to deploy each at the stage of the marketing funnel where its natural strengths are most relevant.
KOLs are the natural fit for the Top of Funnel (TOFU): generating awareness, building brand recall, and establishing category associations at scale and speed.
If millions of target consumers need to learn about a product's existence within a compressed timeframe, the reach and cultural visibility of a macro or mega-KOL is difficult to replace through any other channel.
This logic applies especially to product launches, rebrands, and campaigns timed to high-stakes retail moments where first-mover visibility is strategically important.
A mega-KOL in entertainment with 3 million followers can generate more than 5 million impressions in 48 hours — something no single KOC or even a small group of KOCs can match.
KOCs excel in the Middle and Bottom of Funnel (MOFU/BOFU): consideration, trust-building, and driving the final conversion action.
Once consumers are aware of a brand, their next behavioral step is to seek validation from real people who have actually used the product before spending money on it.
A coordinated seeding effort with 30-100 KOCs generating authentic, detailed reviews can decisively influence this critical consideration stage.
AlgoData's 2024 consumer survey data from Vietnam found that 67% of online shoppers read at least three peer reviews before completing a purchase.
The majority of those shoppers turn to TikTok, YouTube Shorts, and e-commerce platform comment sections to find those reviews — all channels where KOC content thrives naturally.
A high-performing campaign timeline that combines both channels looks like this:
-
Weeks 1-2: 1-3 macro/mega KOLs create initial awareness, media buzz, and broad reach
-
Weeks 2-4: Activate 30-50 KOCs to seed authentic reviews after 2-3 weeks of genuine product use
-
Weeks 4-8: Continue with a fresh wave of 30-50 new KOC voices to sustain trust and conversion momentum
-
Ongoing: Amplify top-performing KOC content via paid promotion to extend its reach without sacrificing the authenticity that makes it effective
A practical budget split for most FMCG categories is 40% on KOL awareness and 60% on KOC conversion.
This allocation tends to maximize total campaign ROI by ensuring both reach and trust are adequately funded across the full funnel.
Resist the temptation to allocate the majority of budget to KOLs based on impressive follower numbers alone — campaign ROI ultimately depends on conversion events, not impression totals.
5. Measuring KOL and KOC Effectiveness
Effective measurement starts with rejecting vanity metrics that look impressive but tell you little about actual business impact.
Raw follower counts and total likes tell you almost nothing about campaign value when divorced from context about audience quality.
What matters is whether the investment drove meaningful behavior change in target consumers — consideration shifts, website visits, add-to-cart events, and completed purchases.
The most important metric to track is Engagement Rate (ER) — total interactions (likes + comments + shares + saves) divided by reach or follower count as a percentage.
ER is the single best proxy for whether an influencer's community genuinely cares about their content rather than passively scrolling past it with no meaningful response.
Platform ER benchmarks to use as reference points for evaluation:
-
TikTok: Good 5-9%, Excellent above 10%, Weak below 3%
-
Instagram Reels: Good 3-6%, Excellent above 7%, Weak below 2%
-
YouTube Shorts: Good 4-8%, Excellent above 10%, Weak below 2%
-
Facebook: Good 1-3%, Excellent above 5%, Weak below 0.5%
Cost Per Engagement (CPE) translates ER into financial terms and enables direct comparison across influencers of very different sizes and price points.
The CPE formula is straightforward: total spend divided by total engagements generated from that spend.
Example: a macro-KOL costs 50 million VND and generates 100,000 engagements → CPE = 500 VND per engagement.
A micro-KOC costs 2 million VND and generates 15,000 engagements → CPE = approximately 133 VND per engagement, 3.8x more efficient per engagement unit.
Deploying 30 similar KOCs at a total budget of 60 million VND and collecting 450,000 total engagements maintains CPE at 133 VND while generating 4.5x higher total engagement volume than the single KOL placement.
Additional metrics that complete the measurement picture beyond ER and CPE:
-
Conversion Rate: tracked via unique UTM links or dedicated promo codes assigned to each individual influencer account
-
Share of Voice (SOV): your brand's percentage of total online category mentions, with influencer content counted as a key volume driver
-
Earned Media Value (EMV): the estimated equivalent paid media cost of the organic content generated voluntarily by engaged influencers
-
Audience Quality Score: ratio of authentic followers to detected bots, and relevance of the audience to the target demographic profile
-
Content Longevity: how long a piece of content continues receiving meaningful views and engagement after its initial posting date
-
Reach per Dollar: total reach divided by total spend, useful for making cross-scale comparisons between KOL and KOC channels
An important caveat on timing: do not evaluate KOC campaign results at 48-72 hours after publication.
KOC content often needs 2-3 weeks to reach peak traffic as organic search indexing and algorithm recommendations gradually build their distribution.
Premature evaluation will significantly underestimate the true value of the KOC channel and lead to incorrect strategic conclusions about channel effectiveness.
Setting a minimum 30-day measurement window for KOC campaigns is a best practice that consistently produces more accurate ROI assessments.
For longer-form review content such as YouTube Shorts or detailed blog posts embedded in TikTok bios, a 60-day window may be appropriate to capture the full distribution tail.
Tracking traffic referral sources at the product page level — not just top-of-funnel impression data — is essential to attributing KOC impact accurately to revenue outcomes.
AlgoData's KOL/KOC Intelligence module gives brands the analytical infrastructure to evaluate, compare, and track influencers with real data rather than self-reported statistics or surface-level metrics.
The platform aggregates signals from TikTok, Instagram, Facebook, YouTube, and e-commerce platforms including Shopee and Lazada for comprehensive cross-channel visibility.
It builds multi-dimensional profiles for each KOL and KOC in its database, updated in near-real time as new content is published and engagement accumulates.
All data is processed using machine learning models trained specifically to detect abnormal patterns that are invisible to manual review processes.
The core output of every influencer analysis is an Influencer Score — a composite metric built from five weighted components that together capture the full picture of influencer value:
-
Engagement Quality Score (30%): true ER accounting for reach, genuine vs. spam comment ratio, save rate, and reply rate as quality signals
-
Audience Authenticity Score (25%): real follower percentage, bot detection confidence, fake account flagging, and suspicious growth spike identification
-
Content Relevance Score (20%): alignment between the influencer's content themes and the brand's product category, price point, and target audience demographics
-
Growth Trend Score (15%): follower and engagement trajectory over the past 90 days as a leading indicator of future reach and influence
-
Brand Safety Score (10%): collaboration history with competing brands, controversy index based on past content, and risk content detection across historical posts
Competitor Influencer Tracking is one of the most strategically valuable features for brands operating in competitive market categories.
AlgoData continuously monitors which KOLs and KOCs are collaborating with competing brands, analyzes the content produced, and quantifies each influencer's SOV contribution to competitor brand visibility.
This intelligence allows marketing teams to understand exactly where competitors are investing their influencer budgets and how effectively those investments are performing.
The result might be preemptively securing high-performing influencers before a competitor campaign launches, or identifying underserved KOC segments that competitors have overlooked entirely.
AlgoData also provides a KOC Discovery Engine — a search tool that identifies suitable KOCs based on niche, geography, ER range, and audience demographics with granular filter options.
Brands can filter across 20+ criteria: audience age range (18-24, 25-34, 35-44), gender ratio, regional concentration (Ho Chi Minh City, Hanoi, provincial cities), and collaboration history with brands in the same or adjacent categories.
This data-driven discovery approach replaces the time-consuming, inconsistent, and highly subjective manual process of KOC scouting that most brands currently rely on without systematic scoring.
The typical manual scouting process takes 2-3 weeks and still misses many of the highest-performing KOCs because they are not visible through casual browsing or existing agency relationships.
AlgoData's engine surfaces these hidden performers by scoring the full universe of relevant accounts, not just those who self-apply or get referred through traditional channels.
7. Case Study: Skincare FMCG Brand on TikTok
A Vietnamese skincare FMCG brand with annual revenue of approximately 500 billion VND launched a new anti-aging serum line in Q2 2025, using AlgoData's platform to guide influencer selection and performance measurement.
The primary objectives were to increase brand awareness by 30% among women aged 25-40 and to generate 10,000 confirmed orders in the first month of the product's availability.
Total influencer budget for the campaign: 800 million VND, allocated 40% to KOLs (320M VND) and 60% to KOCs (480M VND) based on AlgoData's funnel modeling recommendations.
Phase 1 (Weeks 1-2) — KOL Awareness:
The brand partnered with three macro-KOLs in beauty and lifestyle content, with follower counts of 800K, 1.2M, and 650K respectively across TikTok and Instagram.
Each KOL produced two pieces of content: a TikTok unboxing and first-impression video published immediately, and an Instagram Reel featuring a before/after comparison after two weeks of genuine product use.
AlgoData verified before contracting that all three KOLs had Audience Authenticity Scores above 80 and real ER between 2.8% and 3.6% on recent non-sponsored content.
Phase 1 delivered 8.5 million total impressions with an average ER of 3.2% across all six content pieces published by the three KOLs.
A brand tracking survey fielded at the end of Week 2 showed a 38% awareness lift among the target demographic — exceeding the 30% awareness goal by a meaningful margin.
Phase 2 (Weeks 2-6) — KOC Seeding:
AlgoData's KOC Discovery Engine identified a pool of 45 candidate KOCs in the skincare and beauty niche, from which 30 were selected based on Influencer Score thresholds established in advance.
The selected 30 KOCs had an average ER of 11.4% on recent content and Audience Quality Scores above 75, with audiences concentrated in females aged 25-40 in Ho Chi Minh City and Hanoi.
Each KOC received product samples and a content brief emphasizing genuine use — reviews were not published on unboxing day but only after 2-3 weeks of daily use to ensure authenticity.
Phase 2 generated 2.1 million impressions across 30 creators (average 70,000 impressions per KOC), with an exceptional ER of 11.4% reflecting deep audience engagement with the review content.
The conversion rate from KOC content reached 6.8%, translating to approximately 9,700 confirmed orders attributed to KOC traffic via unique promo codes and UTM links.
The KOL channel contributed an additional 1,200 orders, for a combined total of 10,900 orders — 9% above the original 10,000-order target.
Summary results comparing the two channels:
| Metric |
KOL |
KOC |
| Total impressions |
8.5M |
2.1M |
| Engagement Rate |
3.2% |
11.4% |
| Orders generated |
1,200 (11%) |
9,700 (89%) |
| CPE |
267 VND |
63 VND |
| Conversion Rate |
1.4% |
6.8% |
The overall campaign ROI reached 340%, calculated as influencer-attributed revenue divided by total influencer spend across both channels.
A critical insight from the campaign data: KOC reviews published after 2-3 weeks of genuine daily product use converted at 2x the rate of same-day unboxing content from the same KOC profiles.
AlgoData pre-screening eliminated 40% of initially identified KOC candidates who had low Audience Quality Scores, protecting approximately 192 million VND of the KOC budget from being directed to ineffective placements.
8. Conclusion: Data-Driven Influencer Strategy
KOL and KOC are not competing alternatives that a brand must choose between on an either/or basis.
They are complementary tools that serve different and equally important purposes across the marketing funnel when deployed with strategic intention.
KOLs generate the reach and brand visibility that only scale and cultural recognition can provide at speed.
KOCs build the trust and drive the conversion that only genuine, peer-to-peer authenticity can achieve at acceptable cost levels.
The brands that consistently win at influencer marketing are those that deploy each type with precision: right influencer, right objective, right funnel stage, measured by the right metrics and a clear success definition.
There is no one-size-fits-all solution — every decision must be grounded in data specific to the product category, market, and target audience in question.
As Vietnam's influencer ecosystem matures, quality challenges are growing alongside the opportunity the market presents.
Fake followers, inflated engagement rates, and low-quality sponsored content are persistent problems that waste budgets and progressively erode consumer trust in the influencer channel as a whole.
Without robust measurement infrastructure, even well-intentioned and well-briefed campaigns can fall into traps that are completely invisible without the right analytical tools.
AlgoData KOL Intelligence addresses this directly by providing objective, cross-platform, near-real-time signals that transform influencer decisions from gut-feel assessments to evidence-based strategic choices.
If you are planning your next influencer campaign and want to maximize return on a fixed budget, begin by auditing your current KOL and KOC roster against the five components of the AlgoData Influencer Score.
Identify which placements are delivering on engagement quality and conversion, and which are generating impressive-sounding impressions without measurable business impact.
In a market where every competitor has access to the same pool of influencers, the brand that makes faster, smarter, and more data-informed decisions will consistently outperform over every campaign cycle.
That competitive edge starts with the right analytical foundation — and the discipline to measure what actually matters rather than what is easiest to count.
Request a demo of AlgoData KOL Intelligence to see how your current influencer portfolio scores across the five dimensions, and where the highest-impact optimization opportunities lie.
The brands winning in Vietnam's influencer market in 2025 and beyond will be those who treat influencer marketing as a measurable, data-driven channel — not a creative experiment judged only by whether the content "felt good."
Start with the data, let it guide your influencer mix, and revisit the numbers every campaign cycle to compound the learning.
Related articles:
What is Social Listening?
What is Livestream Commerce?
What is Share of Voice?