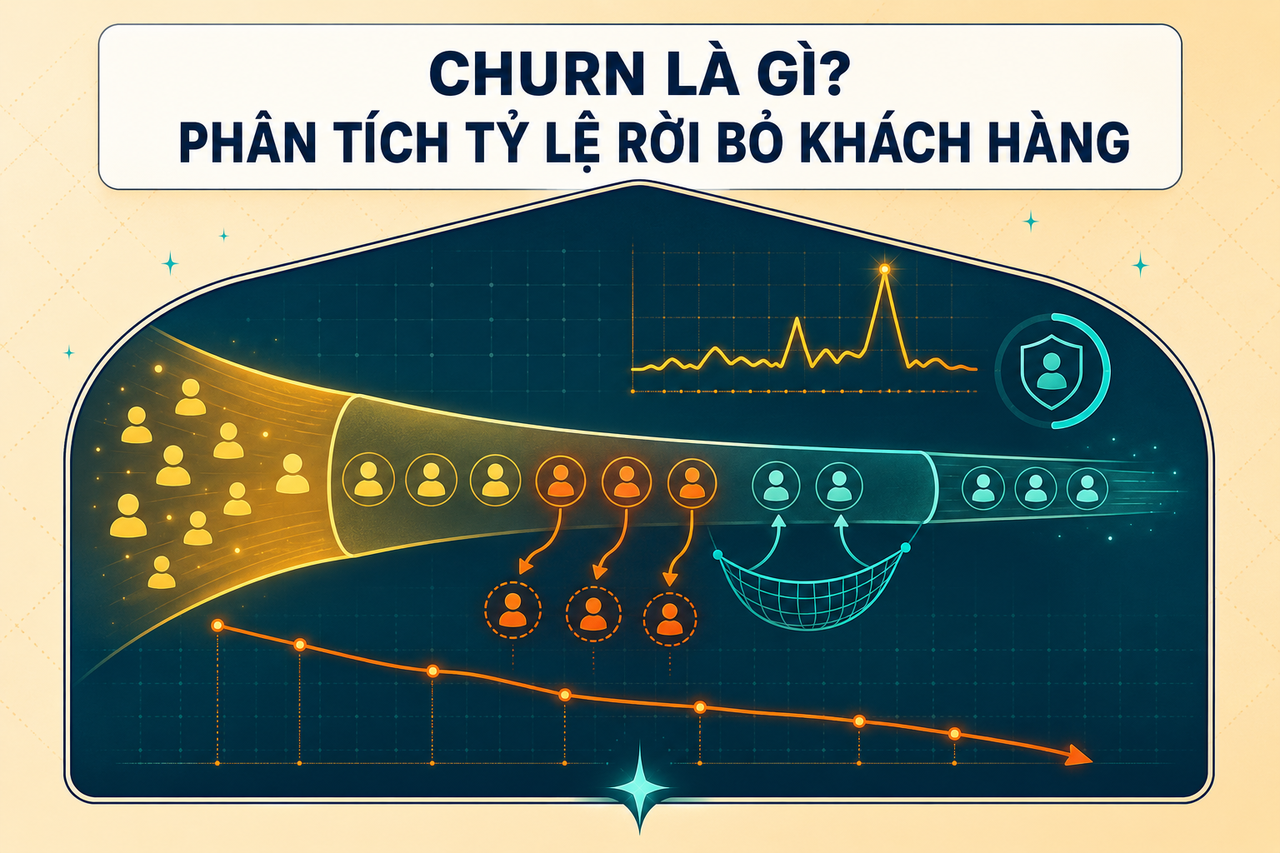
What Is Churn?
Customer churn — also known as customer attrition or customer turnover — is the
phenomenon of customers stopping their purchases or ceasing to use a company's
service within a defined period. In the Vietnamese e-commerce context, churn is
measured along two dimensions: customer churn, meaning the number of customers
lost, and revenue churn, meaning the revenue lost from those departing customers.
These two metrics often tell very different stories and must be tracked in parallel.
The term "churn" originated in the telecommunications and SaaS industries, where
subscription models made tracking cancellations a matter of survival. Today the
concept has expanded across all of e-commerce because the core logic remains the
same: customers who do not return represent revenue that does not regenerate, and
the cost of re-acquisition is significantly higher than the cost of retention. Every
churned customer erodes the compounding value that loyal repeat buyers create.
According to an internal AlgoData survey of more than 200 Vietnamese brands, 68%
had no formal churn dashboard in place and only identified a churn problem when
quarterly revenue declined by more than 15% — a point at which the optimal
intervention window has long since closed. Building a basic churn measurement system
early, even a simple one, is consistently more valuable than waiting for perfect
conditions to deploy an elaborate solution later. The perfect system implemented
six months too late costs far more in lost revenue than a simple system running now.
The distinction between customer churn and revenue churn becomes stark when you look
at customer base composition. If a shop loses 50 small buyers spending an average of
200,000 VND per month, that is a customer churn of 50 and revenue churn of roughly
10 million VND monthly. But if that same shop simultaneously loses one whale customer
spending 15 million VND per month, the customer churn figure is just 1 while the
revenue impact exceeds the entire group of 50 combined. Measuring only headcount lost
can completely obscure the real financial risk to the business.
Each industry has its own churn threshold calibrated to reflect its natural purchase
cycle. For beauty and FMCG categories — where customers typically repurchase every
30 to 60 days — a threshold of 90 days without a transaction is a reasonable churn
definition. For electronics or high-value home appliances with natural cycles of 6
to 12 months, a threshold of 180 to 365 days is far more appropriate. Applying the
wrong threshold produces misleading alerts and wastes retention budget on customers
who are simply between normal purchase cycles.
There are two categories of churn that demand entirely different intervention
strategies. Voluntary churn occurs when customers actively decide to leave due
to dissatisfaction, a better competitor offer, or a perceived lack of value.
Involuntary churn happens due to factors outside the customer's control — an
expired card, a change of address, or a temporary financial constraint. Treating both
with the same approach is ineffective: voluntary churn requires addressing genuine
pain points, while involuntary churn requires a well-timed re-engagement when the
customer's circumstances have changed.
Churn cannot be eliminated entirely, but it can be measured, predicted, and
meaningfully reduced through systematic effort. According to Bain & Company, increasing
customer retention by just 5% can raise profits between 25% and 95% depending on the
industry. For Vietnamese e-commerce businesses competing head-to-head on Shopee,
TikTok Shop, and Lazada — where customer acquisition costs continue to rise — each
retained customer is worth several times the original acquisition investment. This is
the economic case that makes churn reduction one of the highest-leverage activities
available to a growth-stage business.
The basic Customer Churn Rate formula divides the number of customers lost in a
period by the number of customers at the start of that period, then multiplies by 100.
Concrete example: a shop has 1,000 buyers in January; in February only 850 of them
return to make a purchase — Customer Churn Rate = (150 ÷ 1,000) × 100 = 15%.
This figure is alarming in most e-commerce categories and calls for immediate action.
Revenue Churn Rate is calculated separately and reflects the true financial impact.
Formula: (Revenue lost in period ÷ Total revenue at start of period) × 100. If a
shop's Monthly Recurring Revenue is 500 million VND and the following month loses 60
million from churned customers, Revenue Churn Rate = 12%. This is the number that
CFOs and leadership teams care about most because it maps directly to business health
rather than a raw count of people.
Gross Churn and Net Churn offer two different lenses on the same problem. Gross Churn
measures only the revenue or customers lost from those who departed, without factoring
in any offsetting upsell or expansion. Net Churn subtracts expansion revenue from
existing customers before arriving at the final figure. A business can have a Gross
Churn of 15% but a negative Net Churn if existing customers consistently buy more —
this Net Negative Churn state is a powerful indicator of long-term business strength.
Cohort-based churn analysis provides a far richer picture than an aggregate churn
rate calculated across the entire customer base. By grouping customers according to
the month they were first acquired and tracking each cohort's retention rate over time,
you reveal the retention curve of the business. For example: the January 2026 cohort
shows 70% retention at 30 days, 55% at 60 days, and 42% at 90 days — this data
pinpoints exactly where customers drop off and identifies which acquisition months
produced higher or lower quality customers.
The frequency of churn measurement is itself a strategic decision. Subscription
businesses should measure monthly churn to catch problems early. Consumer e-commerce
with regular purchase products is best evaluated at a quarterly cadence. Long-cycle
businesses such as furniture or appliances should calculate annual churn and supplement
it with NPS tracking to generate a leading indicator between purchase events. Matching
measurement frequency to purchase cycle avoids distorted conclusions from looking at
churn over windows that do not reflect actual customer behavior.
Early Warning Signs of Churn
Churn rarely happens overnight — leading indicators typically appear 30 to 60 days
before a customer actually departs. Identifying these signals early is the key to
timely intervention, before the situation deteriorates to the point where the customer
has made a firm decision to leave and the cost of winning them back is several times
higher than the cost of retaining them at the first warning sign. This is precisely
why monitoring leading indicators creates more business value than tracking lagging
ones.
Common behavioral signals to monitor include:
- Declining purchase frequency: A customer who previously bought twice a month now
buys once per quarter — a 75% frequency drop is the strongest and most reliable
churn warning signal available.
- Falling Average Order Value: AOV dropping 30% or more against a 90-day baseline
typically accompanies elevated churn risk — the customer is buying less or trading
down in product tier.
- Email and notification disengagement: Click rates falling from 15% to below 5%
across four consecutive weeks signal serious engagement deterioration.
- Rising return and refund rates: Customers whose return rate spikes abruptly are
often in a dissatisfied state and subconsciously or consciously seeking reasons
to leave the brand.
- Platform engagement decline: Shorter app sessions, fewer pages viewed per visit,
and a falling open rate all signal weakening brand interest before it shows in
transaction data.
Recency — the R in the RFM framework — is the simplest yet most powerful single
indicator for detecting churn risk without complex modeling. A customer who previously
purchased weekly and has now gone 45 days without a transaction has seen their
recency score collapse, and their account should be flagged immediately for retention
outreach. Combining recency with frequency trend allows teams to compute a meaningful
churn probability ranking to prioritize who to contact first, without requiring a
machine learning model at the outset.
Customer service sentiment is a frequently overlooked signal because it is harder to
quantify than behavioral data. Analyzing the content of support tickets, product
reviews, and social media comments can identify frustrated customers — a group whose
churn probability is 3 to 4 times higher than that of customers with no complaints
on record. A customer who opens three support tickets within 30 days without
satisfactory resolution is extremely high risk, even if their transaction history
still looks normal on the surface. Fusing sentiment data with behavioral data creates
a substantially more accurate churn prediction system.
Seasonal patterns must be separated from true churn signals to prevent false positives
that waste retention budget. Customers who buy winter apparel in cold months and
nothing in summer are not necessarily churned — they may simply be seasonal shoppers.
Analyzing each cohort's behavior over 12 to 24 months establishes a personalized
seasonal baseline, so the system only flags customers whose behavior deviates
meaningfully from their own historical pattern rather than from the aggregate
customer base behavior.
Churn Detection With AlgoData
AlgoData provides a real-time churn risk dashboard that integrates directly with
transaction data from Shopee, TikTok Shop, Lazada, and internal POS systems. Each
customer account is assigned a churn risk score that updates daily based on a
combination of behavioral signals, not just the date of the most recent transaction.
The platform processes data from millions of transactions to build a comprehensive
churn risk picture across the entire customer base.
Key analytical capabilities within the AlgoData churn signal dashboard:
- RFM Drop-off Alerts: Automatically flags accounts when Recency or Frequency
scores fall below a defined threshold, delivering same-day notifications to the
retention team.
- Purchase Frequency Trend Monitor: Weekly trend charts comparing the most recent
30-day window against a 90-day baseline to detect statistically meaningful
deceleration patterns.
- Segment Heatmap: Visual map of churn rate broken down by product category,
geographic region, gender, age group, and acquisition channel for precise
problem identification.
- Cohort Retention Waterfall: Retention curve charts by acquisition month that
enable side-by-side comparison of customer quality across different acquisition
cohorts over time.
Sentiment correlation is an advanced AlgoData capability that links customer service
ticket data with individual churn risk scores. When an account shows negative
sentiment in a support ticket alongside a significant recency drop-off, the system
automatically elevates that customer's churn probability score and routes a high-priority
alert to the retention team. Combining two independent data streams — behavioral and
sentiment — improves churn prediction accuracy by approximately 20 to 30 percent
compared to using either signal alone.
AlgoData enables teams to configure custom churn thresholds by product category,
accurately reflecting the real purchase cycle of each segment. Instead of enforcing
a uniform 90-day threshold across the entire catalogue, teams can set 60 days for
beauty and FMCG, 120 days for fashion, and 270 days for electronics. In practice,
one major Vietnamese electronics brand reduced false positive alerts by 40 percent
after switching from a single universal threshold to category-specific configurations
across its catalogue of thousands of SKUs.
AlgoData also supports A/B testing of retention campaigns directly within the
platform, enabling teams to compare the effectiveness of different offers against
matched groups of at-risk customers. After each campaign, the platform automatically
summarizes retention rate, incremental revenue, and ROI, creating a continuous
improvement loop grounded in evidence rather than intuition and team anecdote.
Strategies for Reducing Churn
Effective churn reduction requires a balance between proactive retention — intervening
before customers decide to leave — and win-back efforts to recover those who have
already departed. Proactive retention is consistently more cost-efficient: retaining
a customer showing early churn signals typically costs 5 to 7 times less than winning
back one who has fully churned. This economic reality is often underappreciated by
marketing teams focused overwhelmingly on acquisition metrics.
Proven retention strategies include:
- Personalized win-back campaigns: Send targeted offers to customers 45 to 60
days after their last purchase, personalized based on purchase history. Offers
relevant to the customer's favorite category convert 2 to 3 times better than
generic discount vouchers.
- Loyalty programs for continuous engagement: Points-based programs create a
psychological switching cost that keeps customers returning even when a competitor
is running a promotion. Loyalty program participants typically show 20 to 30 percent
lower churn rates than non-participants.
- Proactive personalized outreach: Email or push notifications carrying product
recommendations derived from purchase history, delivered at the time the customer
historically tends to buy — right person, right moment, right product.
- Service improvement from complaint clusters: Analyze patterns across customer
service tickets to identify the root causes of voluntary churn and address them
structurally, rather than resolving individual cases in isolation.
- Automated reactivation sequences: Tiered communication flows triggered by
recency thresholds — a gentle reminder at day 30, a small incentive at day 45,
a stronger discount at day 60, and a lost-customer treatment after day 90.
Timing of the retention intervention matters as much as the content of the offer.
Research consistently shows that the optimal window for intervention is when the
customer shows churn signals but has not yet made a firm decision to leave — typically
30 to 45 days after the last purchase for short-cycle products like beauty and FMCG.
Intervening too early when churn risk is still low can feel intrusive and even
accelerate departure; intervening too late after the customer has already adopted an
alternative means spending more while converting less.
Intelligent segmentation allocates the retention budget efficiently rather than
spreading it uniformly across all at-risk customers. Whale customers with the highest
LTV should receive the earliest intervention and the best offer, even at some
short-term margin cost. Mid-tier customers warrant personalized communication at a
moderate spend level. Low-value customers are best served by automated low-cost flows,
or in some cases may be left to churn naturally if the cost of win-back exceeds the
projected LTV over the next 12 months.
Measuring the ROI of each retention initiative is a non-negotiable step for continuous
strategy improvement. Comparing conversion rate and incremental revenue between the
intervention group and a held-out control group allows precise ROI calculation. If a
win-back campaign costs 50 million VND but generates only 40 million VND in incremental
revenue over 90 days, that is a clear signal to adjust targeting, timing, or the
offer structure before committing further budget to the same approach.
Predicting Churn Before It Happens
The distinction between leading and lagging indicators is foundational to any
predictive churn capability. Leading indicators surface before churn occurs:
declining purchase frequency, sustained engagement drop-off, negative sentiment in
support tickets — signals on which teams can act immediately. Lagging indicators
such as a fall in MRR or a declining active customer count only become visible after
customers have already left — at that point intervention is costly and often futile
for a meaningful portion of the lost segment.
AI-powered churn prediction models analyze multiple signals simultaneously to generate
an accurate churn probability score for each individual customer. Rather than relying
on recency alone, these models combine: recency score, frequency trend over 90 days,
AOV trajectory, email engagement rate, complaint history, and the customer's own
historical seasonality pattern. The output is an actionable number — for example,
"78% probability of churning within the next 30 days" — that lets retention teams
prioritize outreach and allocate campaign budgets precisely by risk tier.
A real-world result from a Vietnamese cosmetics brand using AlgoData churn prediction:
the system flagged 234 accounts with an average churn probability of 71%. The retention
team ran a personalized win-back campaign over two weeks with offers tailored to each
customer's purchase history. Result: 38% of flagged accounts returned to buy within
30 days — four times higher than the 9% baseline win-back rate without targeting.
Estimated revenue retained: 180 million VND; campaign cost: approximately 12 million
VND — a return of 15 times investment.
Feature engineering is the most important element of building a churn model with
genuine business value. Rather than feeding raw transaction records into a model,
AlgoData computes derived features including: frequency velocity (the rate of change
in purchase frequency), spend ratio (spending in the most recent 30 days compared to
the 90-day average), purchase consistency score (regular scheduled buyer versus
irregular burst buyer), and channel engagement diversity. These engineered features
detect churn signals earlier and more reliably than raw data alone.
Explainability of churn predictions matters as much as accuracy for driving effective
action. Knowing a customer has a 78% churn probability is useful; knowing that this
score is driven by a 60% frequency drop and email click rate falling to zero enables
the team to craft a specific, relevant response rather than sending a generic voucher.
AlgoData provides feature importance breakdowns for each prediction so teams understand
the root cause and can design personalized intervention strategies that address the
actual drivers of churn risk for each customer.
Industry Churn Rate Benchmarks
Understanding industry churn benchmarks is the starting point for knowing where your
business stands relative to the market and for setting realistic improvement targets.
No single "good" churn rate applies universally — each industry has distinct
characteristics around purchase cycle, competitive intensity, and customer loyalty
dynamics. The key is to contextualize your churn rate within the right industry frame
before drawing conclusions about business health.
Reference churn benchmarks for Vietnamese e-commerce by category:
- Beauty and Skincare: Healthy below 20% per quarter — 30 to 60-day purchase
cycles create frequent retention opportunities; elevated churn typically signals
price competition or product quality falling short of marketing promises.
- FMCG (Food, Essential Household): Healthy below 18% per quarter — demand is
frequent and predictable; churn is usually driven by poor logistics experience,
slow delivery, or persistent out-of-stock situations frustrating repeat buyers.
- Fashion and Apparel: Acceptable below 25% per quarter — trend-driven purchase
behavior naturally produces higher churn; the core challenge is converting
trend-driven shoppers into long-term brand loyalists.
- Electronics and Technology: Churn of 60% within six months is normal because
the natural purchase cycle is one to two years; strategy should shift toward upsell
of accessories, extended warranty, and services rather than forcing repeat hardware
purchases.
- Subscription Boxes and Recurring Services: Monthly churn below 5% is healthy;
above 8% per month is a serious warning signal requiring immediate root-cause
investigation.
Comparing against industry benchmarks is just the first step — tracking improvement
trends within your own business over time is more actionable for measuring the
real effectiveness of retention initiatives. If quarterly churn in Q2 is ten percentage
points lower than Q1 after deploying a loyalty program, that is concrete evidence of
the program's ROI. A positive trend over time carries more strategic meaning than a
single benchmark data point taken in isolation.
Benchmarking also needs to account for acquisition channel to avoid misleading
conclusions. Customers acquired through paid advertising typically show 30 to 40
percent higher churn rates than those arriving through organic search or word-of-mouth
referral, because they were attracted by a discount rather than genuine brand affinity.
Segmenting churn rate by acquisition channel reveals which channels bring customers
with the highest LTV and lowest churn, enabling more informed marketing investment
decisions over time.
Net Promoter Score and Customer Satisfaction Score often correlate strongly with
churn rate and can serve as supplementary leading indicators. Research shows that
detractors (NPS 0 to 6) have churn probability three times higher than promoters
(NPS 9 to 10). Tracking NPS by segment over time, combined with behavioral data,
supports a multi-dimensional early warning system rather than relying on a single
signal type for retention decisions.
Conclusion
Churn is one of the most critical metrics reflecting the true health and sustainability
of any e-commerce business — more revealing than gross revenue or total order volume
taken at face value. A business with high churn must continually run expensive
acquisition campaigns to offset the customers it loses, driving marketing costs
upward while overall LTV fails to grow proportionally and profitability erodes over
time. Conversely, reducing churn by just 5% can create a compounding revenue impact
over the long term without any increase in acquisition spend.
Measuring correctly, identifying warning signs early, and intervening at the right
moment are the three pillars of an effective churn-reduction strategy. AlgoData
provides an integrated analytics platform — spanning RFM drop-off detection, purchase
frequency monitoring, sentiment correlation, and AI-powered churn prediction — giving
teams the insight they need to act before customers actually leave. This is no longer
a capability reserved for large enterprises with dedicated data science teams; AlgoData
makes professional data-driven retention accessible to mid-market and growing
e-commerce brands at a practical cost.
Start with three concrete steps: calculate the current baseline churn rate for your
customer base and compare it against your industry benchmark; identify the top 10%
of customers by churn risk and launch an intervention this month; and establish
weekly monitoring of leading indicators so you are acting on signals rather than
waiting for revenue to decline before you respond. These three steps, simple as they
sound, can produce measurable revenue impact within the first quarter of deployment.
Over the long term, a data-driven retention culture is a more durable competitive
advantage than any promotion or discount campaign. The businesses that understand
their customers most deeply — knowing who is about to leave, why they are likely
to leave, and what specific action will keep them — are positioned to build a loyal
customer base that competitors cannot easily replicate. AlgoData is not merely a
churn measurement tool; it is a platform for developing deeper, continuously improving
customer understanding that compounds in value over time. In a Vietnamese e-commerce
market that grows more competitive every year, that depth of customer intelligence
is the difference between businesses that sustain growth and those that must fight
an endless, expensive battle to replace every customer they lose.
What Is RFM?
What Is Cohort Analysis?
What Is Sentiment Analysis?